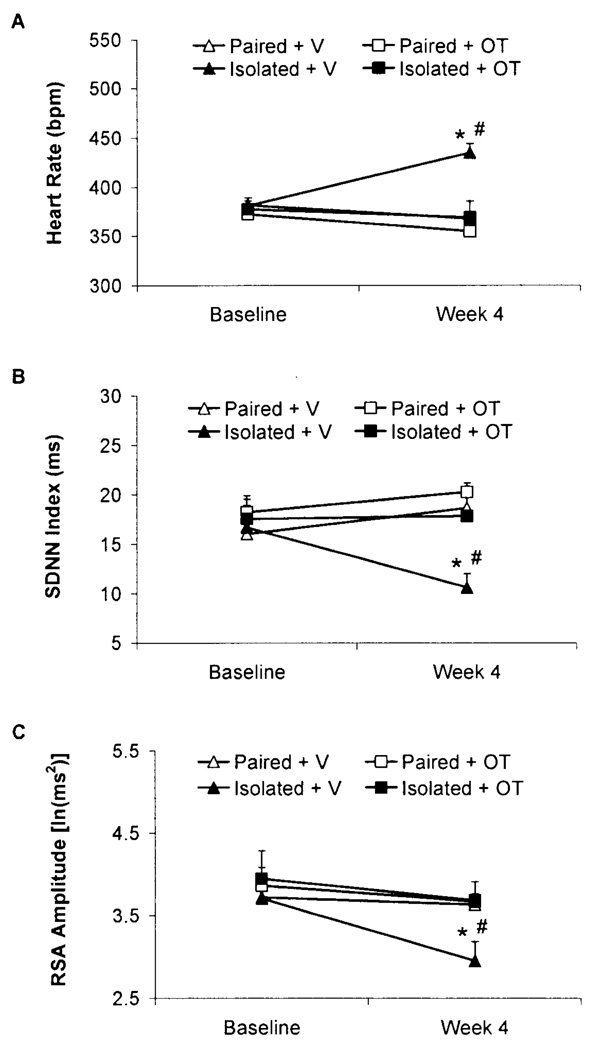
Fig. 1.
Mean (+SEM) HR (Panel A), SDNN index (Panel B), and RSA amplitude (Panel C) in paired or isolated prairie voles administered daily oxytocin (OT; 20µ/50µl/vole, SC) or vehicle (V; 50µl/vole, SC) at baseline and following 4 weeks of isolation/pairing. *P<.05 vs. respective group values; #P<.05 vs. respective baseline value. Note the scale differences among the 3 panels.

