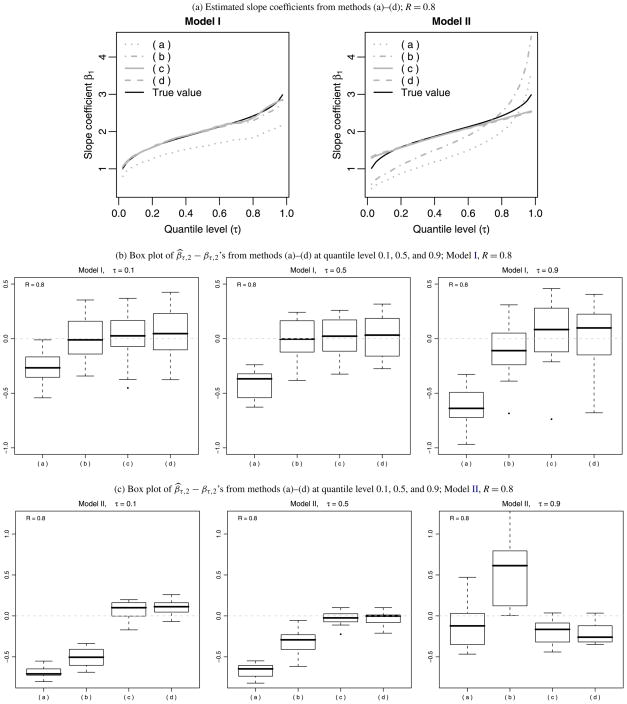
Figure 1.
Comparison of the estimated slope coefficients from methods (a)–(d) under the contamination rate R = 0.8. In sub-figure (a), the black curve is the true coefficient function. The gray solid and dashed lines are the estimated coefficient functions from the proposed method using the true and estimated f (x|w) respectively. The gray dotted line is the estimated coefficients from the naive method; the gray dash-dotted line is that of the regression calibration method. Note that the box plots are box plots of biases.

