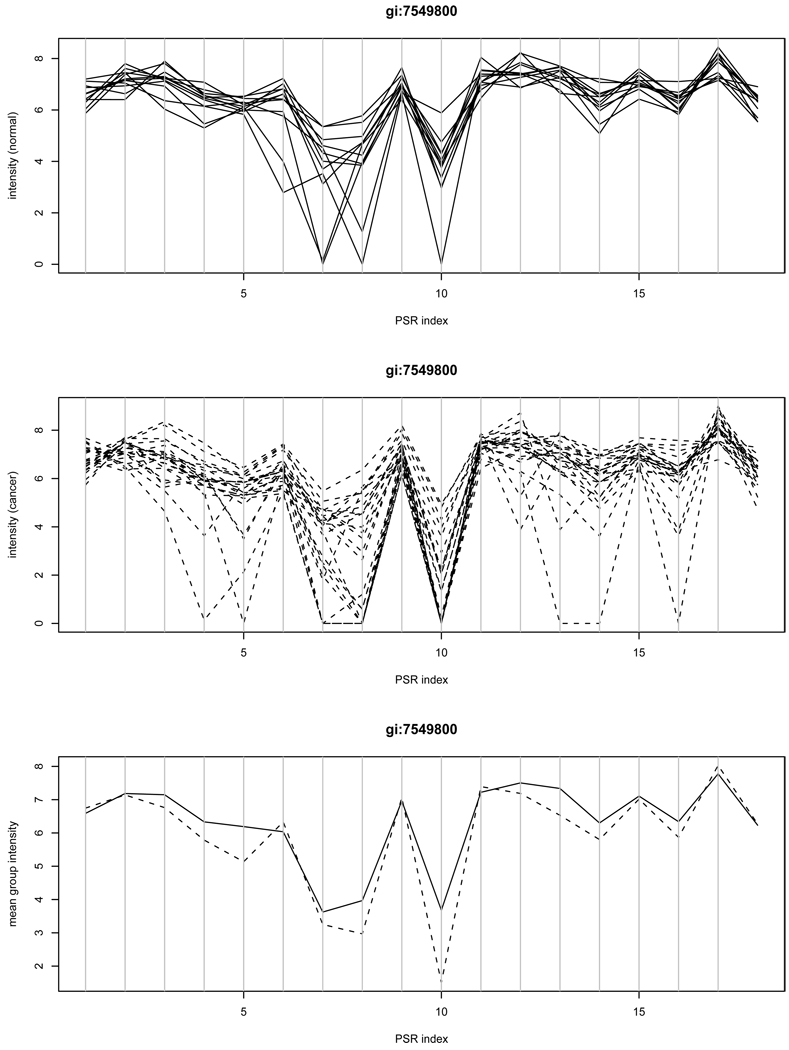
Figure 1.
Intensities of example gene gi:7549800: the group-PSR interaction was detected by ANOVA but not by the SVD method. Unreliable measurements at PSR 10 may lead to a false positive. The top panel contains the plot of intensities of individual normal samples versus PSRs; The middle panel contains the plot of intensities of individual cancer samples versus PSRs; The bottom panel contains the average intensities of normal samples (solid) and cancer samples (dashed) versus PSRs.

