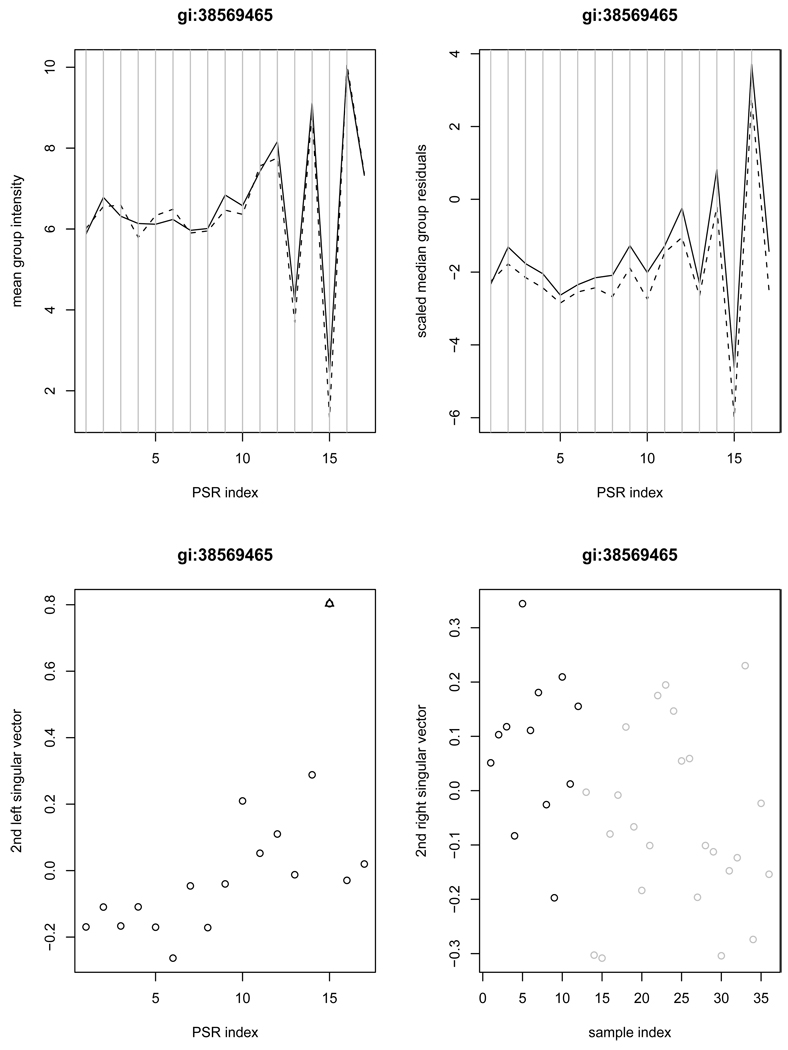
Figure 2.
Example gene gi:38569465 demonstrates the usefulness of the second SVD structure in detecting possible alternative splicing. The left upper panel contains the average intensities of normal samples (solid) and cancer samples (dashed) versus PSRs; The right upper panel contains the median scaled residual values of normal samples (solid) and cancer samples (dashed) versus PSRs; The left lower panel contains the plot of the second left singular vector along with the PSRs (an outlying PSR indicated by triangle); The right lower panel contains the second right singular vector versus samples (black-normal; grey-cancer).

