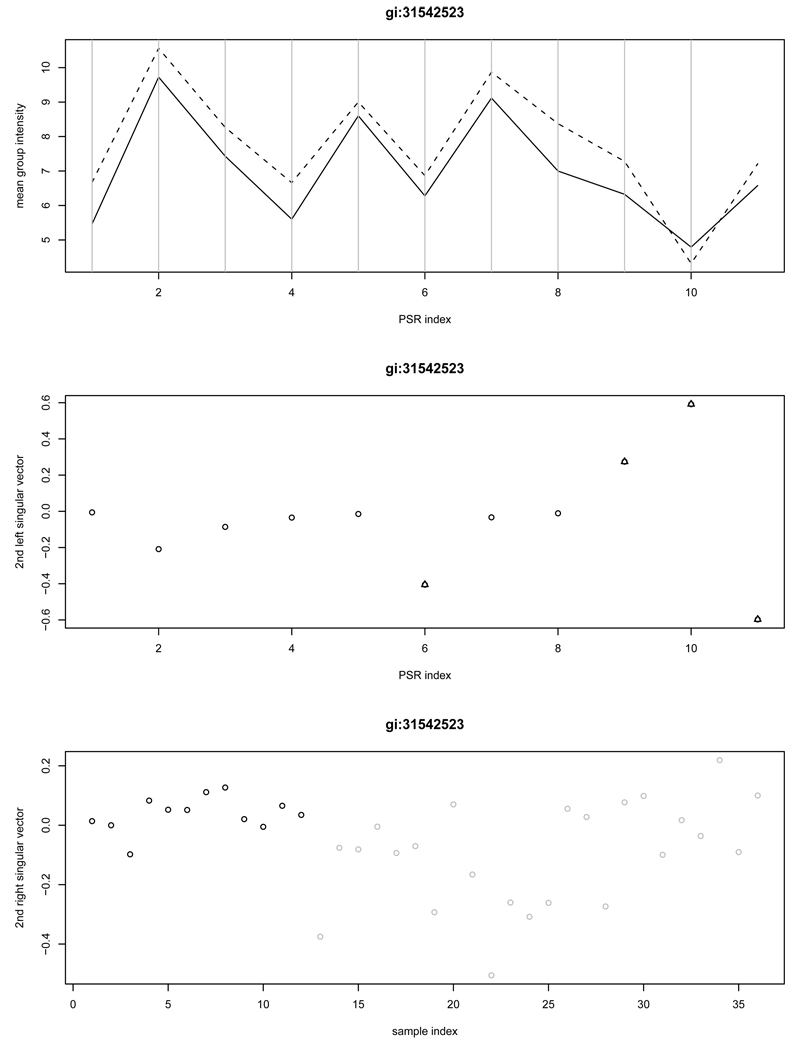
Figure 4.
A validated gene EGFR on chromosome 7 is detected by the SVD method at the second stage but missed by ANOVA. The top panel contain the plot of the average group intensities versus the PSRs; The middle and bottom panels contain the second left singular vector and the second right singular vector, respectively. In the top panel, normal and cancer groups are indicated by solid and dashed line, respectively; In the bottom panel, normal and cancer groups are indicated in black and grey, respectively.

