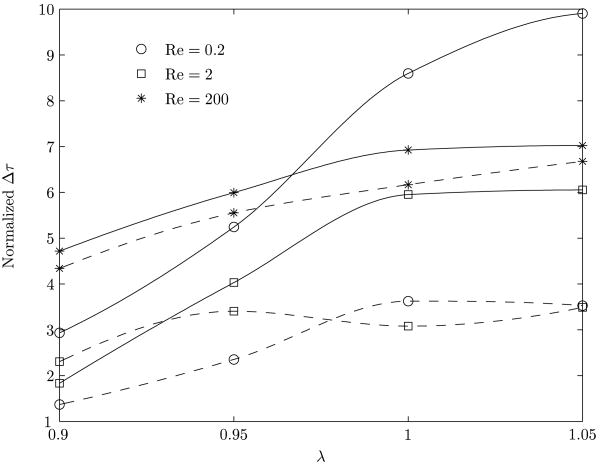
Figure 13.
Variation of the difference between the maximum and minimum shear stress experienced by a point on the vessel wall. The normalization of the shear stress is done with the corresponding base value. The solid line represents the clean interface and the dashed line represents the surfactant coated interface.

