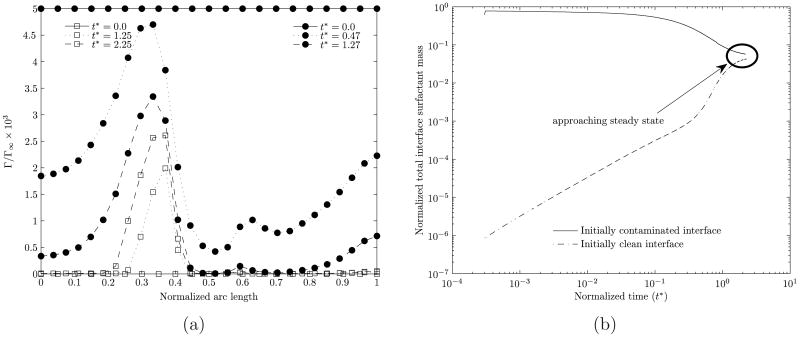
Figure 2.
Interface concentration profiles at various times for two cases starting from different initial prescribed concentrations. (a) Variation of the interface surfactant concentration for various various times. (b) Variation with time of the total interface surfactant mass. The Reynolds number is 0.2, the dimensionless adsorption depth is 4.75 and the aspect ratio is 1.05. In (a) the different symbols indicate the different starting conditions and the three different line types denote different times. The arc length along the surface of the bubble is measured from the rear stagnation point. In (b), the total interface surfactant mass is normalized with 4πa2Γ∞ where a is the equivalent-volume bubble radius.

