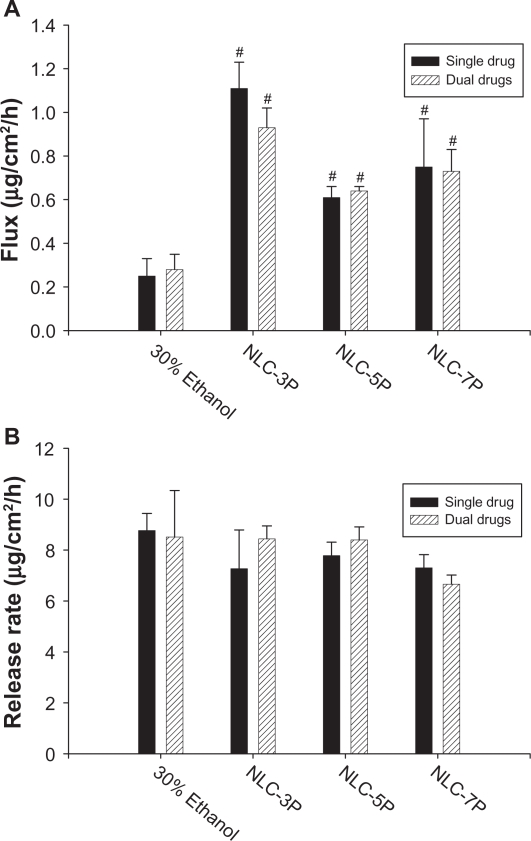
Figure 5.
Flux (A) and release rate (B) of methotrexate from 30% ethanol (control) and nanostructured lipid carrier (NLC) systems with different Precirol/squalene ratios with or without calcipotriol loading.
Notes: Each value represents the mean ± SD (n = 4); # compared with 30% ethanol group; *compared with the system with one drug.

