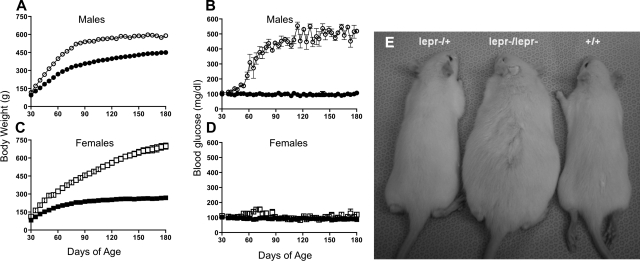
Fig. 2.
Time course of changes in body weight and blood glucose of male and female congenic rats. Rat body weights (A and C) and blood glucose (B and D) of DR.lepr−/lepr− [n = 3 (○) and n = 4 (□)] and DR.+/+ [n = 4 (● and ■)]. All rats were monitored daily from 30 to 180 days of age. Data are means ± SE. Most bars are not visible because of small SE. P < 0.05 vs. age-matched wild-type control group, which persisted up to 180 days of age (ANOVA). Data for DR.lepr−/lepr+ were the same as for DR.+/+. E: representative image of the 3 genotypes at 45 days of age.

