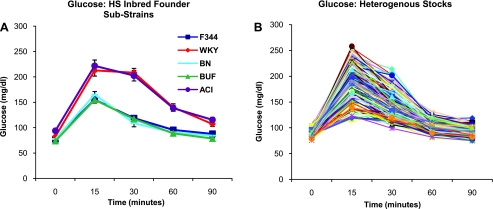
Fig. 1.
Glucose response curves after a glucose challenge in inbred founders (A) and heterogeneous stock (HS) rats (B). Founder curves represent the mean of 6–14 animals within each inbred strain. Each line in the HS graphs represent an individual animal (200 representative HS rats are shown in graph).

