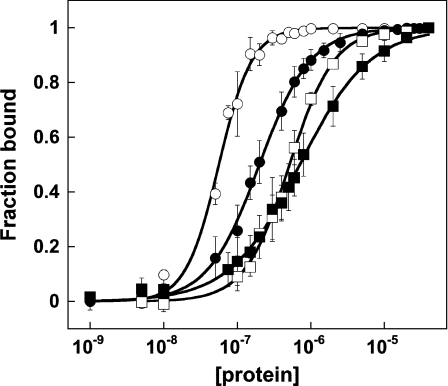
Figure 4. The F60A Alba1 mutant binds DNA more weakly than the wild-type protein.
Alba–DNA-binding curves obtained by gel-retardation analysis. Open and closed symbols are used to denote binding of wild-type (circles) and F60A (squares) Alba1 to either a 39 bp or 16 bp duplex respectively. The sequence of the 39 mer ssDNA was 5′-CCTCGGTGCTAAGTTGATGCTGGTACTCGGAGTATCCCG-3′, which was annealed with a complementary strand to produce the 39 bp duplex. Gel-shift analysis was carried out in triplicate and analysed as described previously [11]. Values are means±S.E.M. The apparent dissociation constants measured for the wild-type and F60A mutant proteins with the 39 bp duplex were 56±2 μM and 520±13 μM respectively. The equivalent values for the 16 bp duplex were 100±4 μM and 710±20 μM. A significant increase in apparent binding affinity (Kd) for the 39 bp duplex when compared with the 16 bp duplex is observed for the wild-type, but not for the F60A mutant (Table 1). Data for the wild-type protein are taken from [11], but were measured at the same time as those for the F60A mutant.

