Fig. 1.

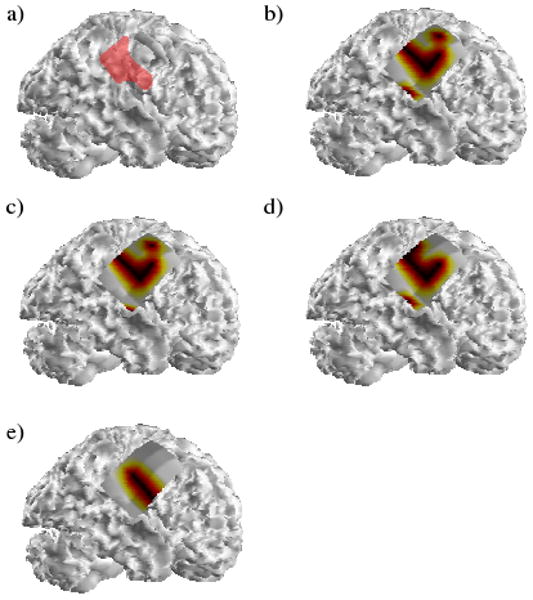
(a) The SOZ identified clinically in the first patient is shown highlighted in red. The activated regions in one of the analyzed seizures corresponding to the theta, alpha, beta and gamma frequency bands are shown in (b-e) respectively.

(a) The SOZ identified clinically in the first patient is shown highlighted in red. The activated regions in one of the analyzed seizures corresponding to the theta, alpha, beta and gamma frequency bands are shown in (b-e) respectively.