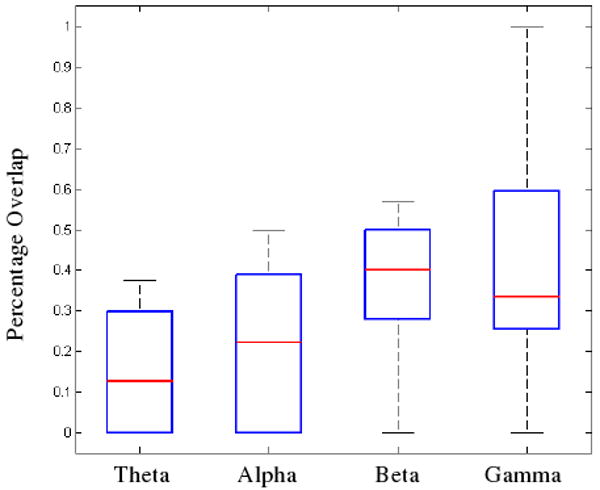
Fig. 3.

The percentage of overlap between the activated regions and the clinical SOZ. The median value for each frequency band is shown in red while the lower and upper edges of each box represent the lower and upper quartiles respectively. The whiskers display the total range of the observed data. The percentage overlap of both the beta and gamma bands with the SOZ was found to be significantly greater than the overlap between the theta band and the SOZ (Wilcoxon rank-sum test; p<0.05).
