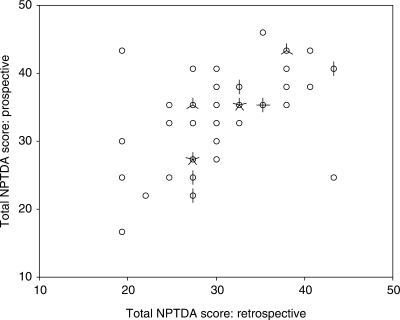
Figure 3.
Scattergram of prospective versus retrospective total Northwick Park Therapy Dependency Assessment scores. The scattergram demonstrates a reasonably close association between prospectively-rated ‘intended levels of intervention’ with retrospective ratings of ‘actual intervention’. Where intended levels of intervention were higher than those actually delivered, the differences corresponded to real deviations from intended practice in most instances.

