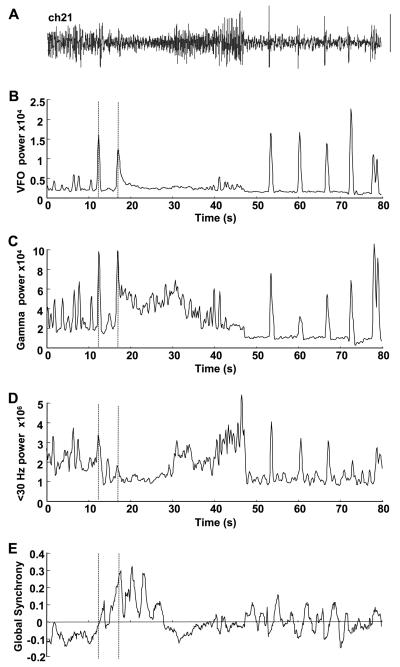
Fig. 2.
Dynamics of focus index components during seizure. (A) Electrocorticogram from channel 21 in patient A used to illustrate the patterns of change in frequency bands and global synchrony shown. An 80-second epoch is illustrated. Scale bar = 0.1 mV. (B) Peak VFO power from sliding window power spectral density estimate of bandpass-filtered data (80–500 Hz). (C) Gamma peak power from bandpass-filtered data (30–80 Hz). (D) Low-frequency peak power from windowed data bandpassed at 1–30 Hz. (E) Global synchrony measure for channel 21 during the 80-second epoch. Units for power are μV2; synchrony units are arbitrary. Note none of these measures alone reveals changes unique at any single point during the transition from normal to ictal activity. Dashed lines show the time location of the two events highlighted in the expanded trace in Fig. 1: the interictal-like event and the following onset of a long run of high-frequency rhythm.

