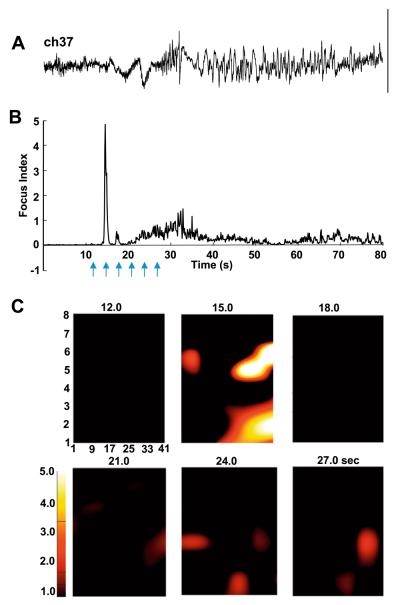
Fig. 4.
Focus index and focus localization for patient B. (A) Reproduction of raw electrocorticographic data from channel 37, 80-second epoch, for reference against the focus index. Scale bar = 0.2 mV. (B) The focus index changes over time for the channel in (A). Note the large, transient positive score at 15.0 seconds corresponding to the onset of increased VFO and gamma power at that time. The peak focus index score at this time contrasted sharply with values prior to the electrographic seizure, and was circa fivefold higher than at any other point during the seizure. Arrows indicate the time points used for the grid examples below. (C) Time-specific maps of focus index score for the 48-channel grid used in this patient. Individual electrode scores were interpolated within the area of the grid, but not outside this area. Note the high positive score is seen simultaneously in two main regions (electrodes 29/37/46 and around electrode 42 at the edge of the grid). Additional point sources for high focus index scores are also seen throughout the grid, both at the detected time point of initiation of the electrographic seizure and for several tens of seconds during the event.

