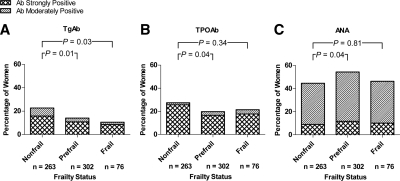
Figure 1.
Prevalence of autoantibodies in women of incremental states of frailty in WHAS I and II. Shaded regions in bars indicate percentage of women within the respective frailty-status group who were seropositive for TgAbs (A),TPOAbs (B), and ANAs (C). Study-specific probability weights were used to derive the percentages. P values were determined by the χ2 test.

