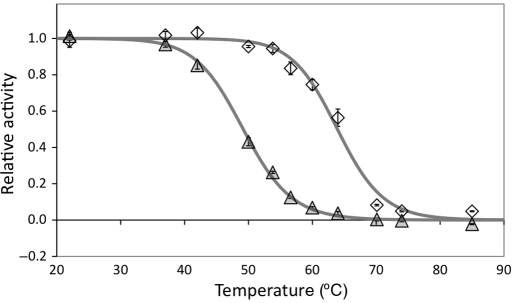
Fig. 3.
Thermal stability. Yeasts displaying gI2.5.3T88I (diamonds) or rI4.5.5 (triangles) were incubated at the indicated temperature for 30 min, returned to room temperature, labeled with FITC-conjugated IgG and analyzed by flow cytometry. The FITC signal relative to non-displaying cells was normalized by the 22° sample. Data represent mean ± standard deviation of triplicate samples.

