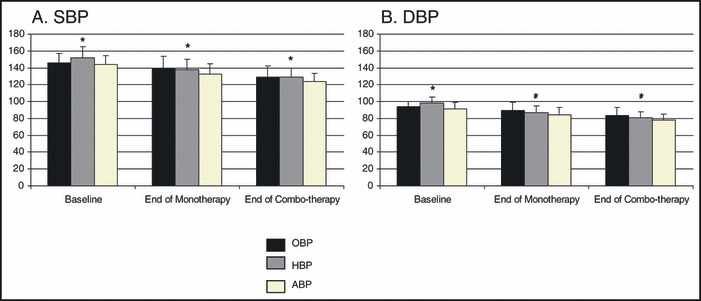
Figure 2.

Blood pressure (BP) by office, home, and ambulatory methods at each study time point. Panel A represents average systolic blood pressure (SBP) and panel B displays average diastolic blood pressure (DBP). Error bars are the standard deviation. Baseline office BP (OBP) (n=418), home BP (HBP) (n=414), ambulatory BP (ABP) (n=391). End of monotherapy OBP (n=418), HBP (n=404), ABP (n=322). End of combination therapy OBP (n=363), HBP (n=341), and ABP (n=289). *Overall P<.0001.
