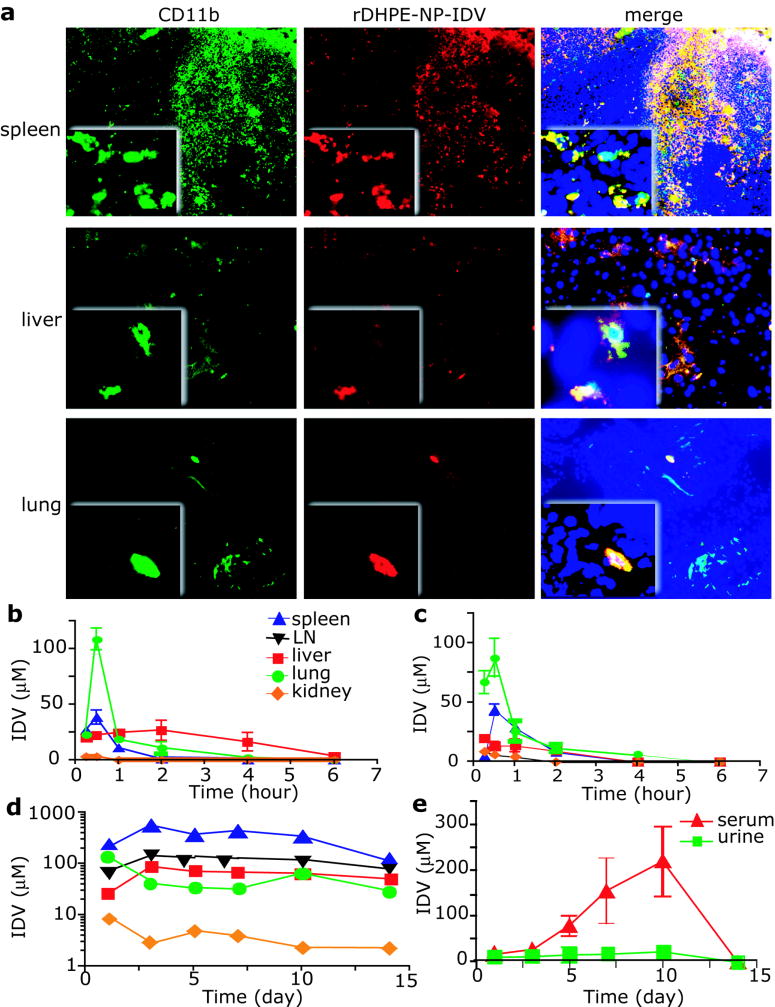
Figure 4.
NP-IDV tissue distribution and pharmacokinetics. (A) Sections of spleen, liver, and lung from mice at day 5 after transfer of rDHPE-NP-IDV–labeled BMMs were stained for CD11b and examined by fluorescence microscopy. Higher magnification inserts demonstrate the presence of rDHPE-NP-IDV (red) colocalized in the cell cytoplasm of CD11b cells (green). BMMs (yellow) were abundantly present in spleen but were less in liver and lung. (B-E) IDV distribution in targeted tissues and body fluids was assessed in mice treated with a single intravenous dose of (B) IDV sulfate solution, (C) cell-free NP-IDV, or (D-E) NP-IDV-BMMs. In contrast to IDV concentrations in mice treated with NP-IDV-BMMs, nadirs within 6 hours after treatment in mice treated with IDV sulfate solution or NP-IDV, levels were prolonged in tissues and plasma over 14 days in mice treated with NP-IDV-BMMs. Data represent mean ± SEM for 4 mice/group per time point. Magnifications are (originals) × 100 and (insets) × 400 [42].

