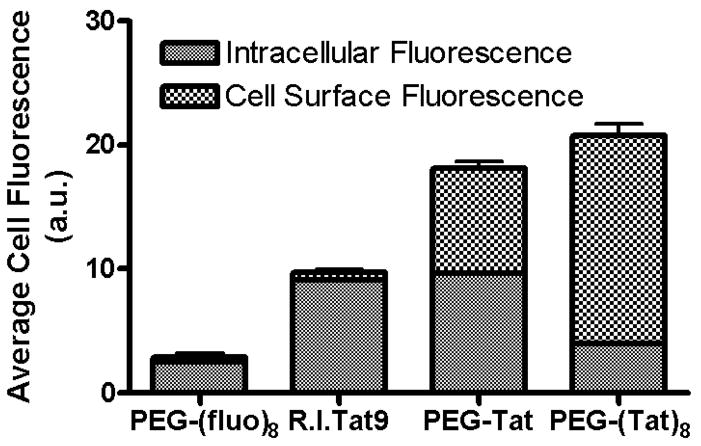
Figure 6.
Quantitative data from flow cytometry showing the intracellular fluorescence and cell surface bound fluorescence of PEG10k-(fluorescein)8 (no Tat), R.I.CK(fluorescein)-Tat9 (Tat alone), PEG3.4k-R.I.CK(fluorescein)-Tat9 (PEG-Tat, 1 copy Tat) and PEG10k-[R.I.CK(fluorescein)-Tat9]8 (PEG-Tat, 8 copy Tat) after 24 h incubation with MT-2 cells at 37°C. The total cell associated fluorescence was quantified by flow cytometry. The intracellular fluorescence was measured after the cell surface-bound fluorescence was quenched by 0.2 mg/ml trypan blue at pH 5.8. The cell surface bound fluorescence is the difference between the total cell associated fluorescence and the intracellular fluorescence [98].

