
Fig. 5.
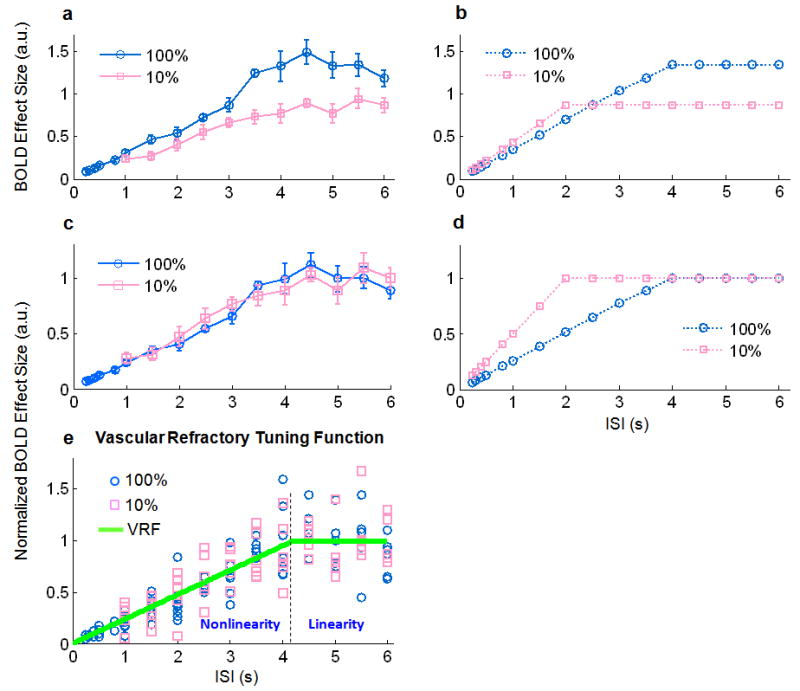
Vascular ceiling vs. refractory effect. a. Group-averaged (n=10) BOLD effect sizes estimated from the measured fMRI signals within V1 in response to stimuli with various ISIs and a 100% (blue) or 10% (pink) visual contrast. b. Theoretical predictions of the BOLD effect sizes at various ISIs in response to 100% or 10% stimuli, by assuming a BOLD ceiling effect. c & d. Curves shown in c and d correspond to the curves shown in a and b, respectively, after normalizing (to 1) the corresponding means of the BOLD effect sizes when ISI≥4 s. e. Scatter-plot of the individual subjects' BOLD effect sizes, normalized in the way described as above, for both the 10% and 100% visual contrasts. A piece-wise linear function fitting all of the points is illustrated by two segments of green lines separated at ISI=4.2 s, which represents the vascular refractory period. Error bars in b and c represent the s.e.m. across subjects.