
Figure 1.
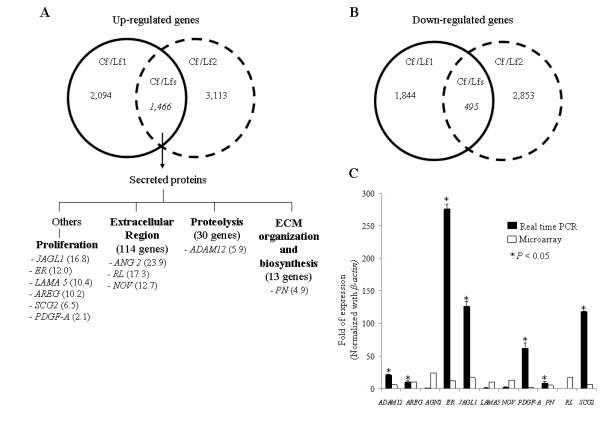
Genome wide expression analysis of Cf and Lfs and gene validation by real time PCR. A Vane diagram showed common up-regulated genes (A) and common down-regulated genes (B) in Cf (Cf/Lfs). In this study, eleven genes encoded secreted proteins involved in induction of epithelial cell tumorigenesis including proliferation, invasion, metastasis and angiogenesis were selected from 4 main different groups of biological functions (A). The numbers in the parentheses represent folds of gene expression level of Cf over those in Lfs. The results show the comparison of gene expression levels measured by real time PCR and oligonucleotide microarray (C). Folds of expression represent fold changes of gene expression level in Cfs as compared to that in Lfs.