
Figure 6.
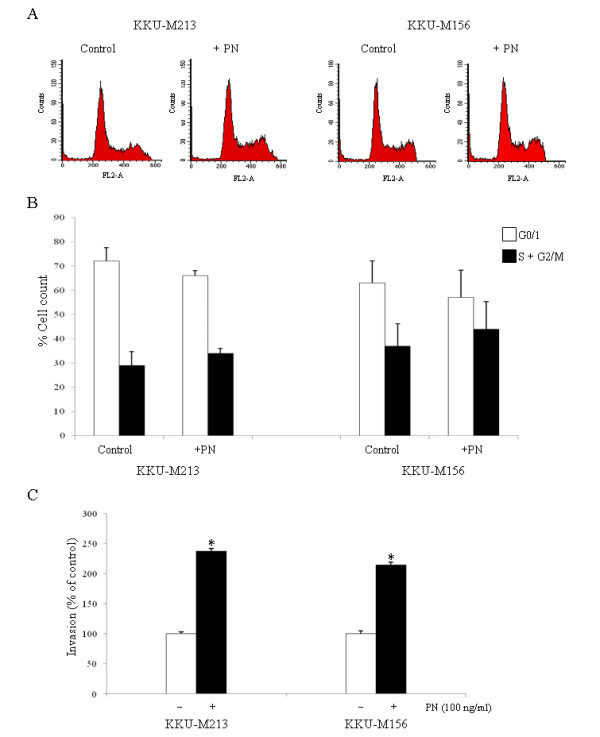
Cell cycle distribution and invasion analysis of cancer cells with and without stimulation by PN. Cell cycle analysis of KKU-M213 and KKU-M156 induced by PN (A). PN could drive cells from G1 into S and G2/M phases of the cell cycle when compared to control cells without PN treatment (B). Invasion induction by PN on KKU-M213 and KKU-M156 CCA cell lines is shown (C). Numbers of invaded cells when no PN was used served as control and were adjusted to be 100% (white bar). The increase of invaded cells induced by PN is observed and shown by a black bar. Each bar graph represents mean ± SD of three independent experiments. An asterix represents a P value of less than 0.05.