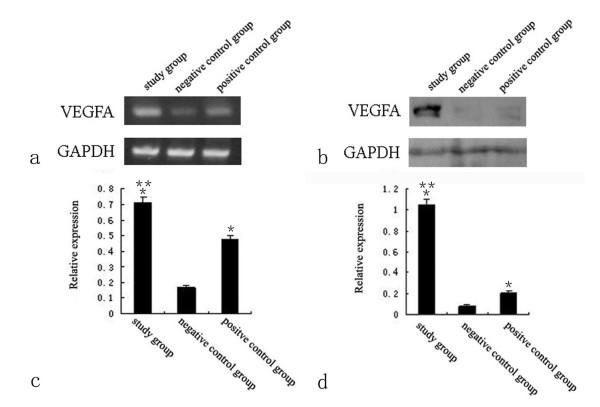
Figure 3.
VEGFA mRNA and protein expression on day 3. VEGFA mRNA expression revealed by RT-PCR (a) and VEGFA protein expression determined by western-blot (b) and its relative expression (c and d) showed the expression of study group was the highest and the expression of negative control group was the lowest(*, compared with negative control group; **, compared with positive control group).

