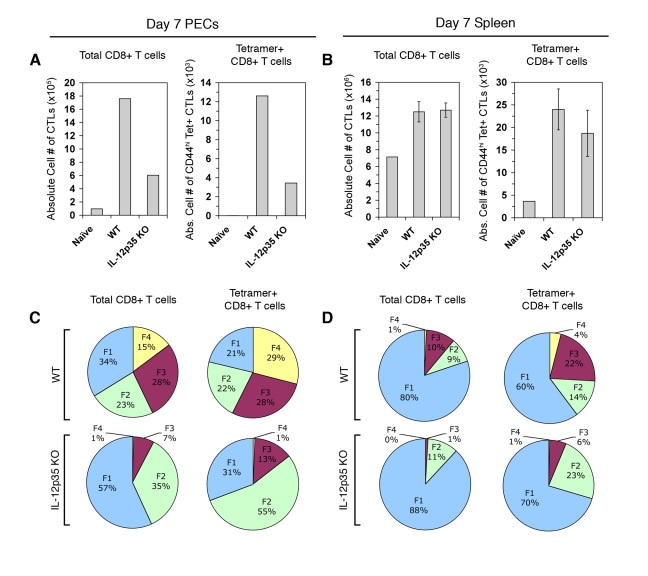
Figure 4. Primary CTL activation and differentiation in Il12a −/− mice.
PECs and spleens were analyzed for CTL activation on day 7 post-vaccination in WT and Il12a −/− mice. A and B) Total CD8α+ TCRβ+ cells and CD44hi Kb/SVLAFRRL+ CD8+ T cells were enumerated in PECs (A) and splenocytes (B) of WT naïve, WT primed, and Il12a −/− primed mice. C and D) Subpopulation distribution is shown in total CD8α+ cells and Kb/SVLAFRRL+ CD8α+ cells in PECs (C) and splenocytes (D) of WT and Il12a −/− primed mice. PEC samples were pools of three mice. Bar graphs are shown as mean ± SEM of three mice. Pie charts are shown as mean values for the spleen samples. Data are representative of three independent experiments.

