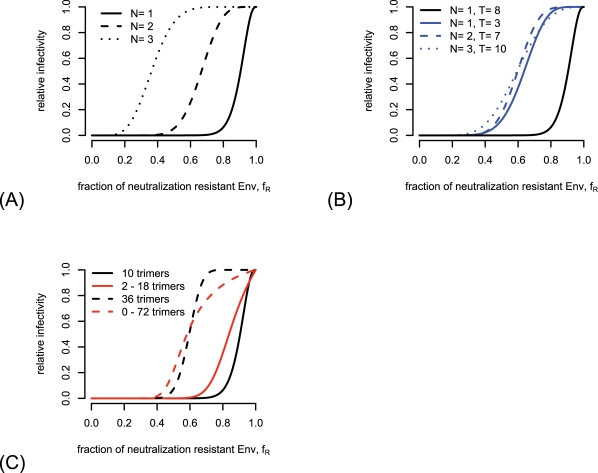
Figure 3. The relative infectivity in the basic model predicted by equation 4 as a function of the fraction  of neutralization resistant envelope proteins.
For plot (A) and (B) we assume that each virion has exactly 10 trimers. For plot (A) and (C) the stoichiometry parameter of entry  equals
  , according to our estimates in [1]. (A) Dependence of the relative infectivity on the stoichiometry parameter
  . (B) Dependence of the relative infectivity on the stoichiometry of entry
  . (C) Dependence of the relative infectivity on the mean and variance of trimer numbers. For this plot the stoichiometry parameter
  is set to
  . Solid lines are based on a mean number of trimers equal to 10. Dashed lines have a mean trimer number of 36. For the black curves the number of trimers is exactly 10 respectively 36 and the distribution of trimer numbers for the red curves are discrete uniform distributions with 2 to 18 respectively 0 to 72 trimers.

