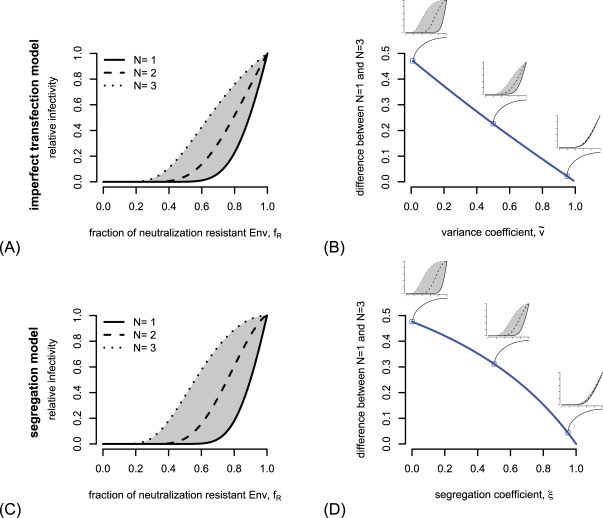
Figure 4. Loss of distinguishability of estimates of the stoichiometry of neutralization  in the imperfect transfection model and the segregation model.
(A) Dependence of the predicted relative infectivity in the imperfect transfection model on the stoichiometry parameter  , the entry parameters for this figure are
  and
and  . (B) The area between predictions for
  and
and  is depicted in dependence of the variance coefficient
  . The decrease of this area size with increasing
  makes the differentiation between different stoichiometries of neutralization difficult for high values of
  . (C) and (D) show the same phenomenon for the segregation model. The parameters for (C) are
  and
and  . The stoichiometry of entry for (B) and (D) is
  .
.

