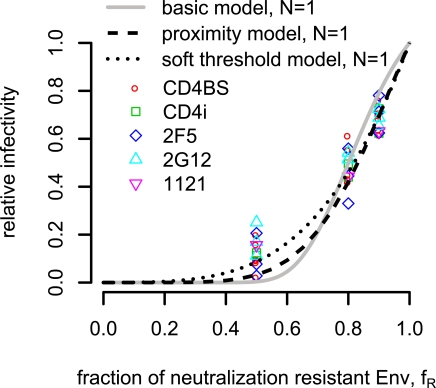
Figure 5. Relative infectivity curves for the best estimate of the stoichiometry of neutralization  in the different models.
The imperfect transfection model and the segregation model are omitted due to the lack of reliability of the estimates. In the other models, the best fit is obtained for  . The entry parameters are included from the estimation of the entry parameters in [1]:
  for the basic model,
  for the proximity model and
  for the soft threshold model.

