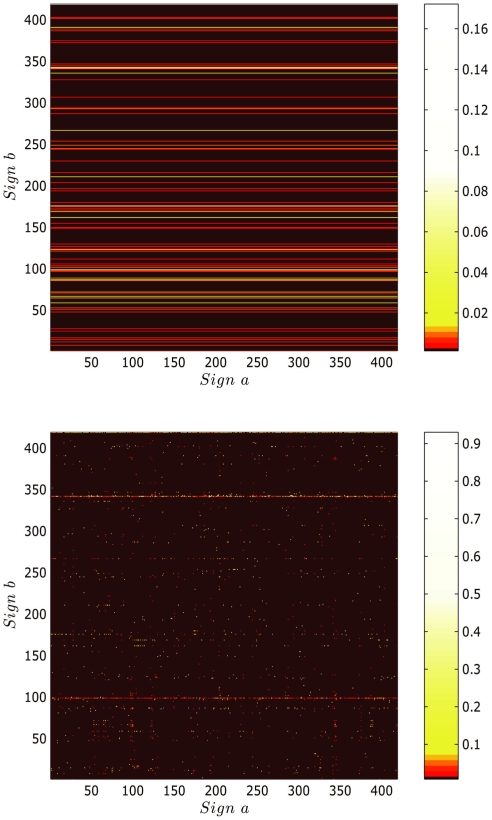
Figure 5. Bigram probability P(b|a) for a random distribution with no correlations amongst the signs (above) and for the EBUDS corpus (below).
Horizontal lines in the upper matrix imply that the conditional probability of a sign b following a sign a is equal to probability of sign b itself. The bigram probability P(b|a) after Witten-Bell smoothing is shown in the lower plot. The difference between the two matrices indicates the presence of correlations in the texts.

