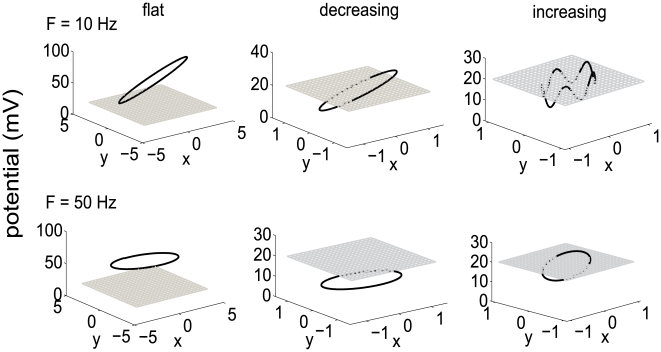
Figure 5. Limit cycle plots for the flat, decreasing and increasing firing patterns, when no threshold is applied in the neuron model.
A detailed explanation of this autonomous dynamical system can be found in the Appendix S1, where x axis represents  , and y axis is
  . The degree of tilt when F = 10 Hz is much larger than when F = 50 Hz. Threshold value is represented by the grey grid square.

