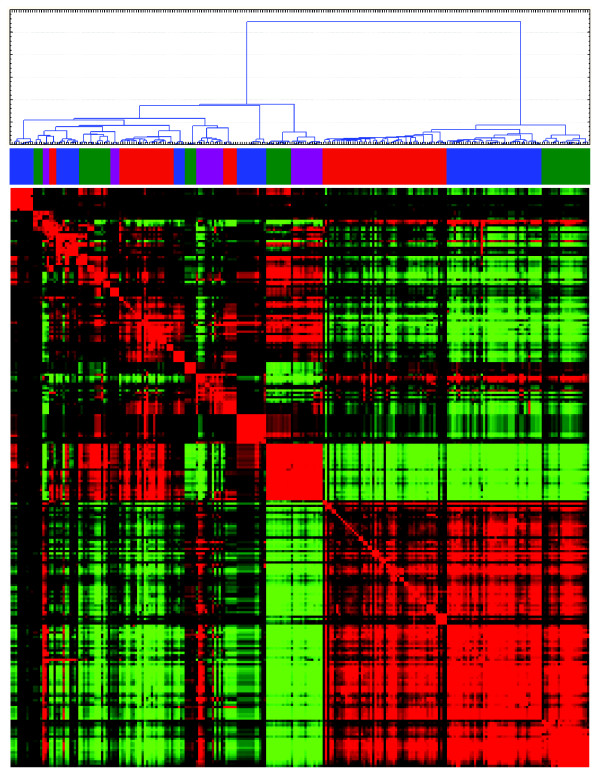
Figure 6.
Identification of correlated TFBS as identified using the -1500,+500 portions of the promoters. A hierarchical cluster analysis with adjoined heat map of correlations of the portion of the TFBS that showed sizeable correlations and indicated in Additional file 5, Figure S5.

