Figure 2.

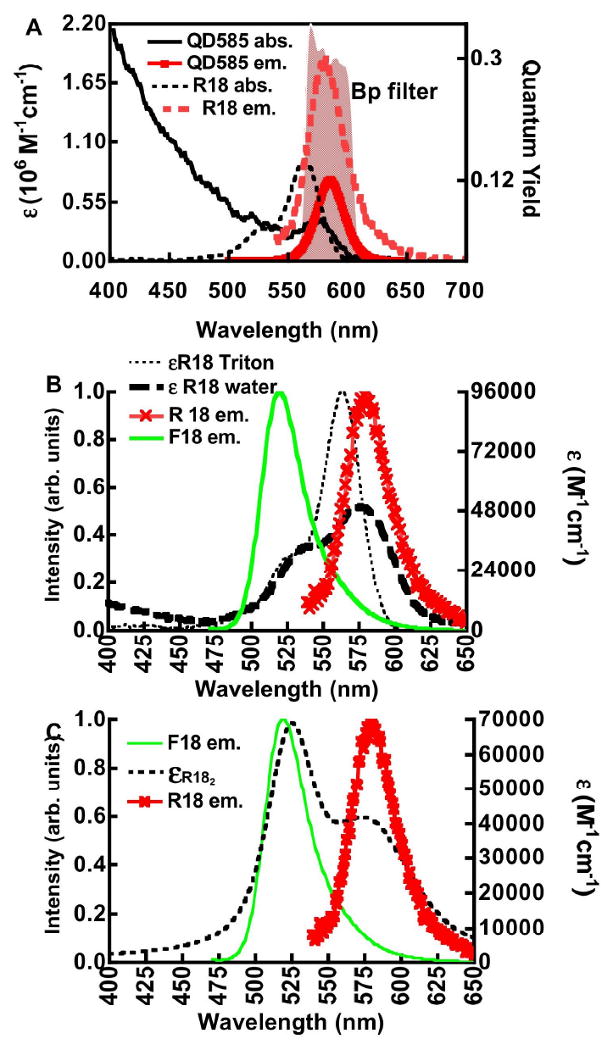
A. Fluorescence calibration and spectroscopic properties of R18 and QD585 dots. Right hand ordinate. Plot of absorption spectra of R18 (R18 abs.) and QD585 quantum dots (QD585 abs.). Left ordinate. Plot of quantum distribution functions of emission of R18 (R18 em.) and QD585 (QD585 em.) normalized by the maximum quantum yield of each probe. The shaded spectral region represents a bandpass filter centered at 580 nm and a component of one of 3 detection channels of a BD flow cytometer. B. Left ordinate. Plot of normalized emission spectra of F18 (F18 em.) and R18 (R18 em.). Right ordinate. Plot of absorption spectra of R18 solubilized in Triton X-100 (εR18 Triton) and neat buffer (εR18 water). C. Left ordinate. Plot of normalized emission spectra of F18 (F18 em.) and R18 (R18 em.). Right ordinate. Resolved spectrum of R18 H-dimer (εR182) modeled from the compound spectrum of R18 aggregates (εR18 water) in Figure 2B using parameters (λmax, ε, and bandwith FWHM) taken from Selwyn and Steinfeld (see text for details).30
