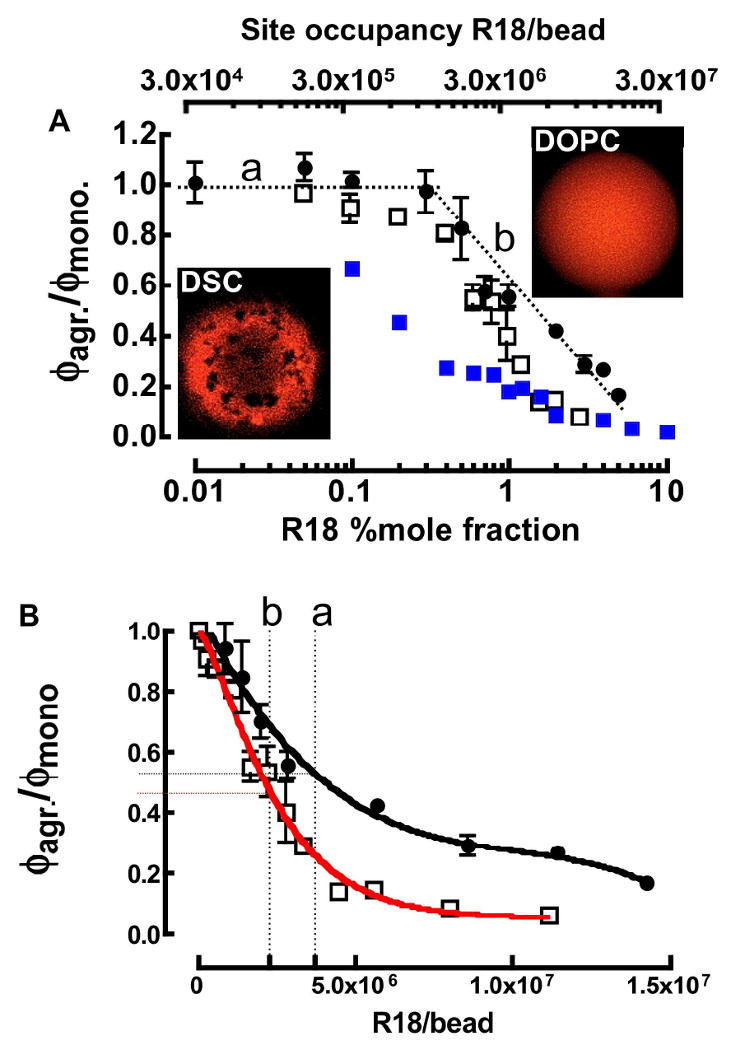
Figure 3.

A. Confocal micrographs of DOPC (top) and DSC beads (bottom) at 20°C. Relative quantum yield ϕagr/ϕmonomer of R18 solubilized in supported lipid membrane bilayers: (filled circles) DOPC at 37°C, (open squares) DSC at 37°C and (filled squares) DSC at 20°C on beads. ϕmonomer refers to the quantum yield of soluble rhodamine B or R18 in Triton X-100. (a) Dotted line marks site occupancy/mole fraction region below the onset of self-quenching. (b) Line shows site occupancy/mole fraction region in which the self-quenching of R18 in DOPC membranes changes linearly on log scale. B. Relative quantum yield ϕbead/ϕmonomer of R18 on DOPC (filled circles) and DSC (open squares) lipobeads as a function of site coverage at 37°C. The curves represent theoretical fits to the data using Eqns. 8 and 9 respectively. The vertical dotted lines refer to the maximum site occupancy numbers of R18 at the end of a binding time course (in Figure 5) for (a) DOPC and (b) DSC beads. Horizontal tie lines to the y-axis represent the degree of self-quenching in R18 occupied DOPC and DSC lipobeads.
