Figure 1.
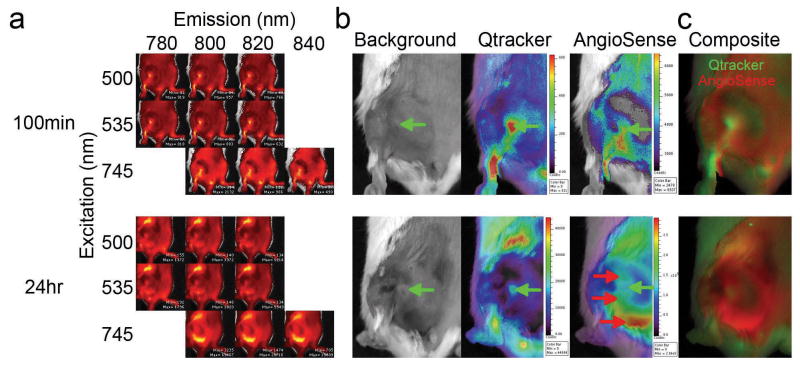
Dual fluorescent imaging of tumor vasculature and its leakiness. In SCID mice carrying s.c. BHK tumors, both Qtracker and AngioSense detect tumor vasculature 100 min after i.v. injection of a 200 μL mixture of both Qtracker (0.1 μM) and AngioSense (3.3 μM). However, the AngioSense can visualize tumor vascular leakiness after 24 hours of probe injection. (a) Raw image data after sequential acquiring of the indicated excitation/emission matrix. (b) The unmixed concentration maps for Qtracker and AngioSense. Green arrows indicate the initial tumor vasculature (Qtracker) and red arrows indicate subsequent regions with vessel leakiness. (c) The composite images of Qtracker (green) and AngioSense (red) signals.

