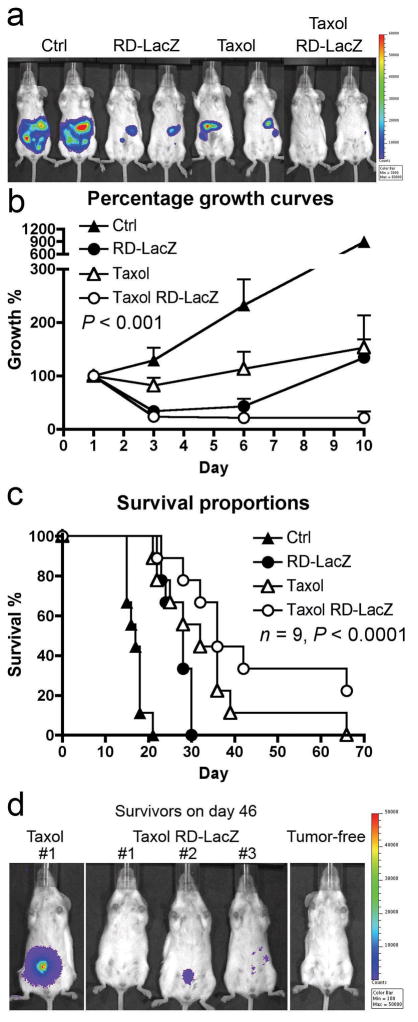
Figure 4.
Survival and tumor load in tumor-bearing mice treated with Sindbis and/or Taxol®. Mice were injected with 4×10⁶ ES2/Fluc cells on day 0. Mice were then divided into 4 groups of 9 animals, and were treated with Sindbis/LacZ (i.p.) daily from day 1 to day 11, and/or with Taxol® treatments (16 mg/Kg) on day 1, 4, 7 and 11. (a) Day 10 image. (b) Quantitative analysis of tumor growth, day 1 tumor load signal was set at 100% for each individual mouse for comparison with later images (day 3, 6, and 10). (c) Mouse survival was monitored and P value was generated by log-rank test of trend. (d) The surviving mice were imaged on day 46 to determine if they have any tumors.

