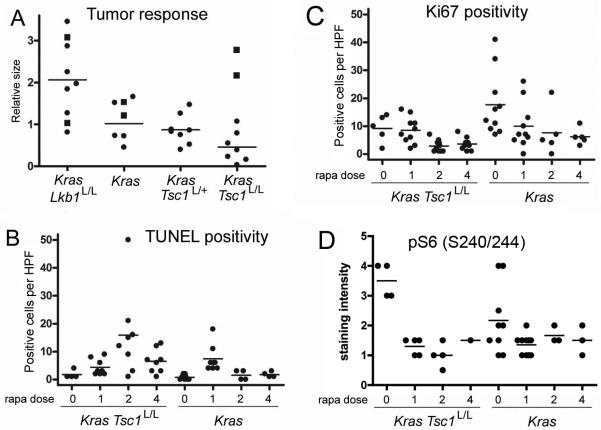
Figure 4. Quantitative tumor response, apoptosis, proliferation, and pS6 expression in response to rapamycin in LSL-KrasG12D Tsc1L/L, LSL-KrasG12D, and other mice.
(A) Relative change in tumor burden in mice treated with rapamycin for 2 weeks (circles). MRI scans from before and after treatment were assessed for tumor volume in mm3 by a blinded observer, and the ratio between after treatment and before treatment volumes was plotted. Six mice of various genotypes were placebo-treated controls in this experiment, shown as squares. The lines indicate average change among the treated mice.
(B) Scatter plots of number of positive cells per high power field (HPF) in lung tumor nodules stained to show evidence of apoptosis (TUNEL). The mice had genotypes LSL-KrasG12D Tsc1L/L or LSL-KrasG12D, and were treated with rapamycin 6mg/kg every other day for 0, 1, 2, or 4 doses, as indicated on the x axis.
(C) Scatter plots of number of positive cells per HPF in lung tumor nodules stained to show evidence of proliferation (antibodies against Ki67), as in B.
(D) Scatter plots of relative staining intensity for pS6(S240/244) in tumor nodules from rapamycin-treated mice, as in B.
For B-D, all pairwise comparisons between LSL-KrasG12D Tsc1L/L and LSL-KrasG12D tumors after the same number of doses are not significant (P > 0.05 by Mann Whitney test), except for the comparison between TUNEL positivity (B) after 2 and 4 doses, p=0.028 and 0.048 respectively.

