Figure 3.
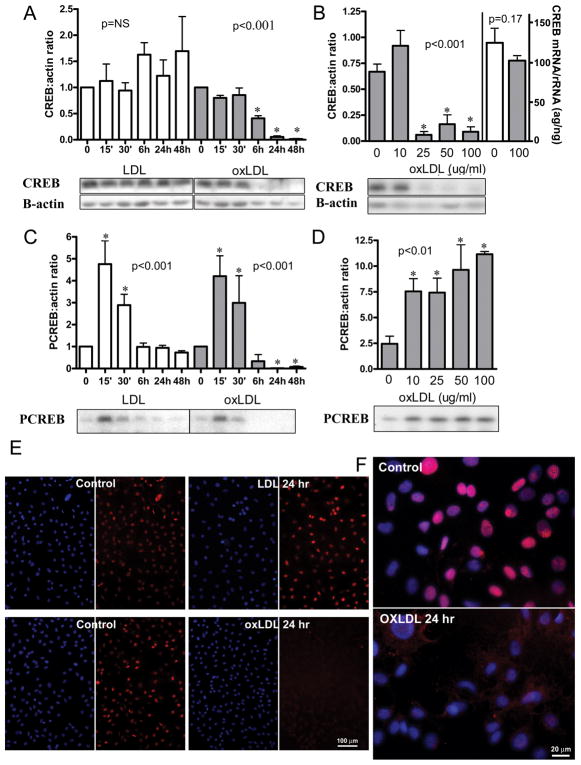
Effect of LDL and oxLDL on CREB content, activation, and mRNA in primary culture rat VSMC: CREB and PCREB protein were quantified by densitometric analysis of Western blots. CREB mRNA was quantified by Quantitative RT PCR and normalized to 18S rRNA. (A) Time course for CREB content with exposure to 100μg/ml LDL or oxLDL. (Error bars represent SD from two separate experiments with total n=4, except for duplicate samples at 6H; LDL: NS; oxLDL: p value for trend <0.001, *p<0.05 vs. 0 time). (B) dose response for CREB protein (first 5 bars) and CREB mRNA (last 2 bars) content at 24 hours of exposure to oxLDL (Error bars represent SD from two separate experiments with total n=3–5 for protein levels and n=5 for mRNA levels; p value for protein trend <0.001, *p<0.05 vs. 0 μg/ml; p value for mRNA difference = 0.17); (C) time course for CREB activation with 100μg/ml LDL or ox LDL (error bars and sample number as in A; ox LDL and LDL: p value for trends <0.001, *p<0.05 vs. 0 time); (D) dose response for CREB activation at 15 minutes of exposure to oxLDL (error bars and sample number as in B; p value for trend <0.01, *p<0.05 vs. 0 μg/ml); (E and F): CREB localization after 24 hour exposure to LDL or oxLDL. Cy3 (red)=CREB; DAPI (blue) =nuclei. Representative western blots are shown. Results shown are representative of >10 separate experiments. Values are mean ± SD, P values for trends are by one way ANOVA, p values for comparison to control are by ANOVA with Dunnett’s post test.

