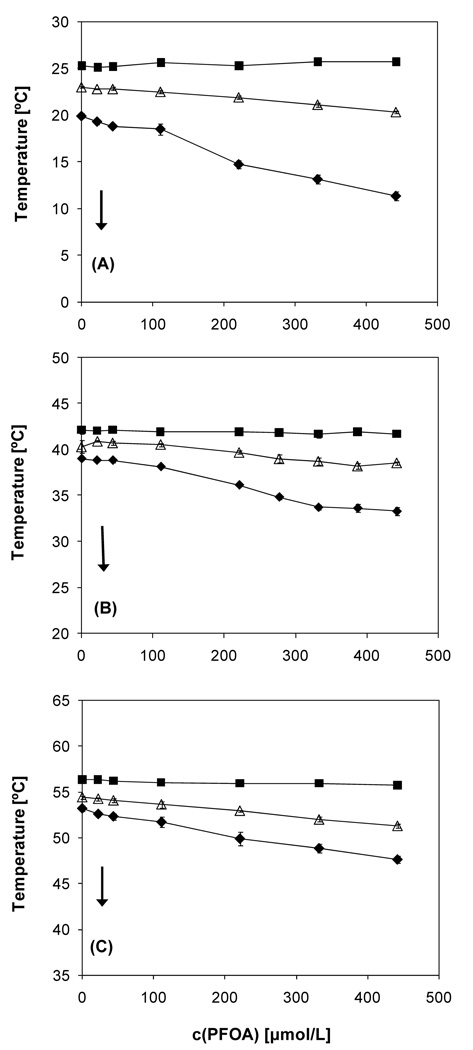
Figure 2.
Partial phase diagram of (A) DMPC-PFOA, (B) DPPC-PFOA (Xie et al., 2007) and (C) DSPC-PFOA mixtures obtained from the DPH fluorescent anisotropy measurements. As indicated by the arrows, all samples were cooled at a rate of 0.2 °/minute. The data points represent averages of at least three experiments ± one standard deviation. ■ Onset of main phase transition; Δ maximum of the main phase transition; ◆completion of the main phase transition.

