
Figure 10.
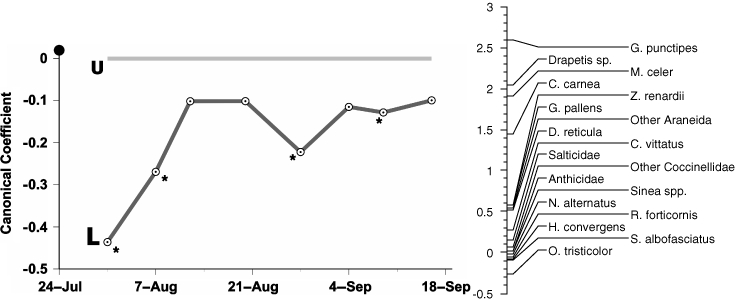
Principal response curves (PRC) showing the long-term negative effects possible from a single broad spectrum Lygus insecticide [(L) = acephate spray] on the predatory arthropod community comprising of ca. 20 taxa in cotton, 1997, Maricopa, Arizona, USA. Species weights indicate strength of the trend for each species or species group, with values > 0.50 generally reflecting the trends shown. Weights < −0.50 indicate a negative association or inverse of the trends depicted. The product of species weight and the canonical coefficient (y-axis) for a given treatment and time equals the natural log change in density of that species relative to the control. Dot at top of y-axis denotes timing of an acephate spray; Stars, denote significant differences between the acephate treatment and the UTC (y = 0) by date (P < 0.05). The PRC analysis over all dates was significant (P < 0.01) based on an F-type permutation test. Adapted with permission from Elsevier83.