
Figure 12.
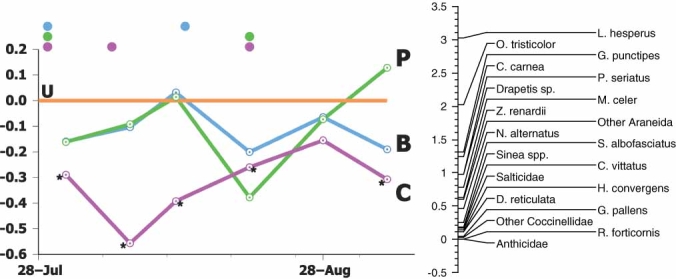
Principal response curves (PRC) showing the effects of different whitefly control strategies on the predatory arthropod community comprising of ca. 20 taxa in cotton, 1997, Maricopa, Arizona, USA. Species weights indicate strength of the trend for each species or species group, with values > 0.50 generally reflecting the trends shown. Weights < −0.50 indicate a negative association or inverse of the trends depicted. The product of species weight and the canonical coefficient (y-axis) for a given treatment and time equals the natural log change in density of that species relative to the control. U = UTC (control); C = a rotation of conventional chemistry; P = pyriproxyfen-initiated rotation of IGRs; B = buprofezin-initiated rotation of IGRs; Dots denote timing of sprays of chemistry with corresponding color; Stars, denote significant differences between adjacent treatment and the UTC (y = 0) by date (P < 0.05). The PRC analysis over all dates was significant (P < 0.01) based on an F-type permutation test. Adapted with permission from Elsevier83.