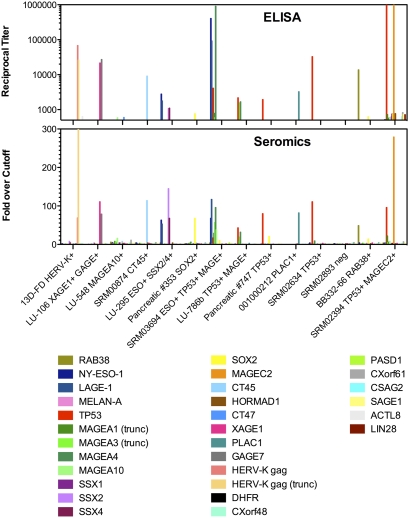
Fig. 3.
Comparison of ELISA and seromics data on panel of antigens using sera with known specificity. Fourteen control sera, plotted along the x axis and known to react with individual antigens shown next to their name, were tested against a series of 30 proteins indicated. In the top panel, reciprocal titers were determined by ELISA from serial dilutions for each serum against each protein, as described in Materials and Methods. Only reciprocal titers greater than 500 are shown in ELISA to allow relevant comparison with seromics data that were generated using a single 1:500 serum dilution. In the lower panel, fold-over-cutoff results of seromics are shown following data transformation and normalization, indicating seroreactivity against the same 30 proteins spotted on ProtoArrays. Trunc, truncated proteins.

