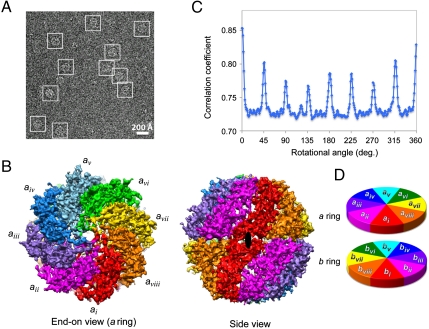
Fig. 1.
TRiC 4.7 Å asymmetric cryo-EM density map and the identification of the 2-fold axis between its two rings. (A) A typical 300 kV image of ice embedded TRiC in the both-ring-closed conformation. Representative particles are highlighted by white boxes. (B) End-on view of a ring and side view of both rings of TRiC with different subunits in different colors. The identified 2-fold axis is indicated by black ellipsoid in the side view. (C) Rotational correlation coefficient analysis between a ring and b ring. At 0° the two rings have the best correlation score, indicating the location of the 2-fold axis as illustrated in B. Due to the periodicity of the TRiC map, 0° peak of the curve is split, with the other half of the peak at ∼359°. (D) Cartoon diagram depicts the relative orientation of the two rings of TRiC.

