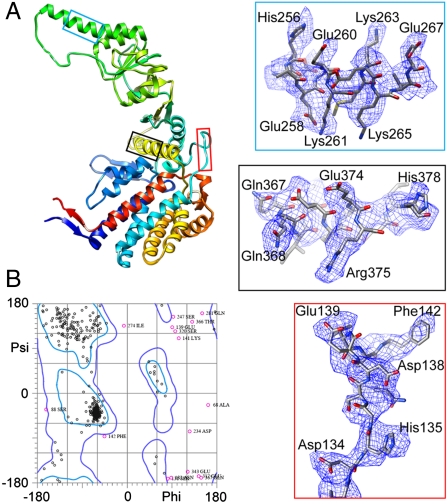
Fig. 4.
The atomic model of CCT2(β) subunit and the match between the aiii density and the model. (A) Optimized atomic model of CCT2(β) with the N terminus in blue and C terminus in red. Zoom in views show the match between three stretches of densities highlighted in different color frames and the corresponding model. (B) The Ramachandran plot of the CCT2(β) model calculated by MolProbity (48) shows that over 95% of the dihedral angles fall within allowable regions.

