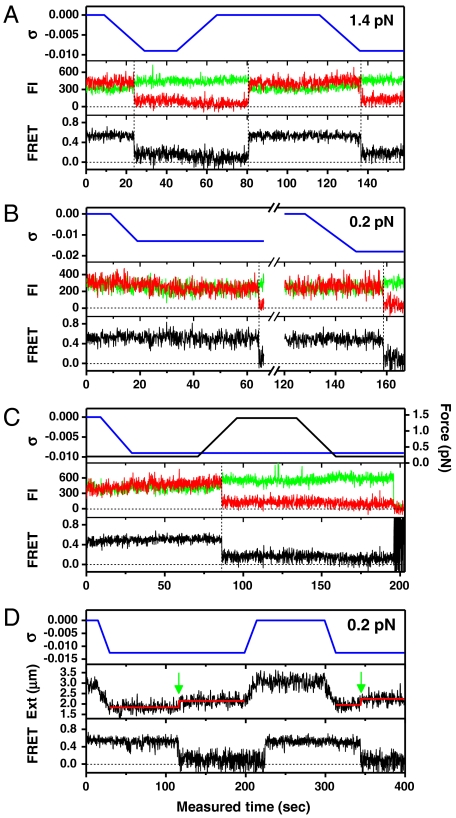
Fig. 3.
Single-molecule time traces for donor and acceptor fluorescence intensities (FI) (Middle) and FRET (Bottom) for the GC core in the presence of torsion (Top, Blue) at (A) 1.4 pN, (B) 0.2 pN, and (C) varying force (Top, Black). (D) Time trace of FRET at 0.2 pN (Bottom) under varying torsion (Top) shown together with the extension of the DNA molecule (Middle). The Red Lines indicate the average extensions of the DNA molecule at σ = -0.013 before and after the B-Z transition detected by FRET measurement (Green Arrows).

