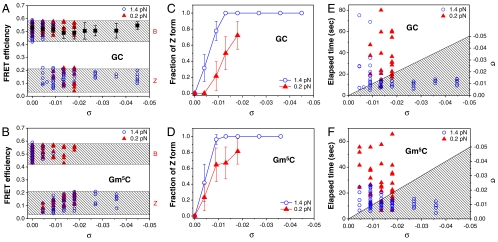
Fig. 4.
Distribution of FEs as a function of σ for (A) GC and (B) Gm5C cores. The top and bottom shaded regions show the ranges of FE for B- and Z-DNA, respectively. The FE of the random core is independent of σ at 1.4 pN (Black Square). Relative populations of the FRET states for (C) GC and (D) Gm5C cores as a function of σ. The elapsed time from the onset of DNA twisting (t = 0) until the transition was observed is displayed for (E) GC and (F) Gm5C cores. In the shaded regions below the line showing completion of DNA twisting in (E) and (F), DNA tethers were being twisted. For data points in the shaded region, the B-Z transition occurred during the twisting. Due to the constant rate of DNA twisting, at any time (Left Axis) during the twisting, σ can be calculated (Right Axis). Data were collected for two different forces (Blue Circle, 1.4 pN; Red Triangle, 0.2 pN). The error bars in (A) are given by standard deviations of the data from the random core, and those in (C) and (D) are the standard errors of the sample proportions.

