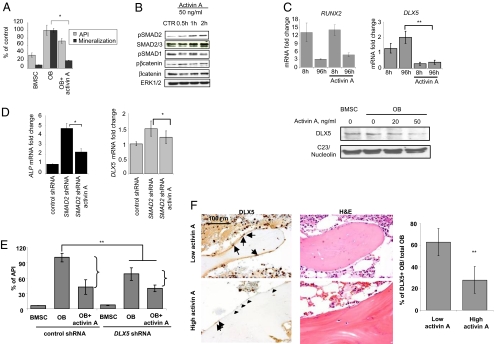
Fig. 3.
Activin A inhibits OB differentiation via DLX5 down-regulation. (A) Healthy donor–derived OBs were differentiated in the presence of activin A (50 ng/mL). ALP activity was detected after 2 weeks of differentiation with a chromogenic substrate and corrected for the number of viable cells quantified via AlamarBlue assay (i.e., API). OB activity was assessed at d 21 of differentiation by quantification of calcium deposits stained with alizarin red. (B) OBs were differentiated for 1 week and then incubated with activin A (50 ng/mL) for the indicated time points. Protein expression of phosphoSMAD2, SMAD2/3 phosphoSMAD1, phosphoß-catenin, β-catenin, and ERK1/2 were assessed by Western blot. (C) OBs were differentiated in the presence of activin A (50 ng/mL) for the indicated time points and the mRNA expression levels of RUNX2 (Left) and DLX5 (Middle) were assessed by quantitative-PCR. (Right) HS27-derived OBs were differentiated in the presence of various concentrations of activin A for 24 h. Nuclear protein extracts were performed to assess DLX5 and nucleolin expression. (D) After SMAD2 knockdown, BMSCs were stimulated with activin A (50 ng/mL) for 48 h and expression levels of ALP and DLX5 were assessed by quantitative PCR. (E) BMSCs were transduced with shRNA targeting DLX5 or control shRNA, and stimulated with activin A (50 ng/mL) in the presence of osteogenic media. ALP activity was detected after 10 d of differentiation with a chromogenic substrate and corrected for the number of viable cells quantified via AlamarBlue assay (i.e., API). (F) BM biopsies from MM patients with low (<50 pg/mL; n = 10) or high (≥50 pg/mL; n = 10) BM plasma levels of activin A were analyzed for DLX5 expression by IHC (counterstained with hematoxylin). The arrows indicate DLX5+ OBs and the arrowheads point at DLX5-OB. H&E staining of a corresponding field is also represented (Left). OB with nuclear expression of DLX5 were quantified and normalized against the total OB number (Right). Error bars represent SD. *P < 0.05, **P < 0.01.

