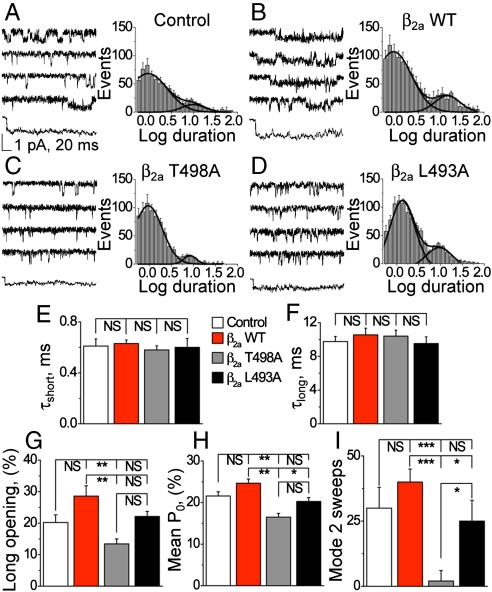
Fig. 2.
Reduced opening probability (Po) and mode 2 gating events in LTCC from β2a WT compared to T498A or L493A expressing ventricular myocytes. Single LTCC current tracings and modal gating analysis from (A) mock-infected control cells, (B) β2a WT infected cells, (C) β2a T498A infected cells, and (D) β2a L493A infected cells. Each panel (A–D) shows representative single LTCC current recordings and an ensemble tracing averaged from 40 sweeps (Left). A histogram in each panel shows that LTCC openings partition into short and long opening times (Right). The time constants (τ) for the short (E) and long (F) opening times are not different between experimental groups. In contrast, the percent of long openings (G), mean Po (H), and sweeps with mode 2 activity (I) are significantly less in β2a T498A compared to β2a WT infected cells. Color-coded legends are as in Fig. 1 and statistical comparisons between groups are denoted as in Fig. 1F. Eight through 10 cells in each group gave 250–300 active sweeps and were used for each data point in E–I.

