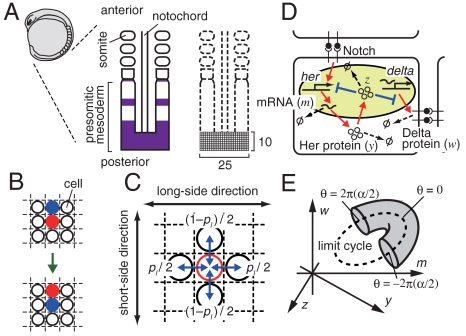
Fig. 1.
Model scheme for the segmentation clock in vertebrate somitogenesis. (A) The presomitic mesoderm (PSM) and the two-dimensional lattice representing the posterior part of the PSM. The purple area indicates the expression of the her gene. (B) Exchange of location between two cells. (C) Each cell exchanges its location with one of its two neighbors in the long-side direction of the lattice with probability pl/2, and it exchanges its location with one of its two neighbors in the short-side direction of the lattice with probability (1 - pl)/2. (D) Negative feedback regulation of the her gene in a cell and intercellular interaction between neighboring cells via Delta–Notch signaling. Production, activation, and transport are represented by red arrows, whereas suppression is shown by blue lines ending with perpendicular bars. Decay of mRNA and proteins is denoted by arrows leading to symbol Ø. (E) Schematic representation of how an initial condition was prepared. The circle drawn with the broken line represents the limit cycle with all the N cells perfectly synchronized in the phase space of m, y, z, and w (Appendix). Initial states of cells are distributed in the shaded region that wraps a part of the limit cycle (see Model and Appendix for details).

