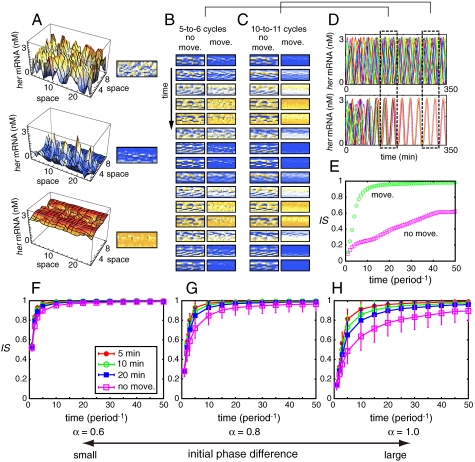
Fig. 2.
Random cell movement enhances the restoration of synchronization. (A) Correspondence between 3D plots of her mRNA concentration and density plots of that. In the density plots orange color indicates high concentration of her mRNA, and blue indicates low concentration. (B), (C) The time courses of her mRNA expression with cell movement (Right Columns; indicated by “move”) and without cell movement (Left Columns; indicated by “no move”) between (B) 124 min and 180 min, and (C) 268 min and 324 min. In right columns of (B) and (C), each cell experienced an exchange of its location with one of its neighbors within 10 min on average. (D) The time courses of her mRNA expression in 15 of N cells when all N cells are fixed in the lattice [Upper; corresponding to left columns in (B) and (C)] and when the cells moved randomly in the lattice [Lower; corresponding to right columns in (B) and (C)]. The 15 cells were chosen randomly among N cells. (E) The time courses of IS corresponding to (D). (F)–(H) The average time course of IS when the magnitude of the initial phase differences between cells was set to (F) α = 0.6, (G) α = 0.8, and (H) α = 1.0. Each cell experienced an exchange of its location with one of its neighbors within 5 min (Red Filled Circles), 10 min (Green Open Circles), or 20 min (Blue Filled Squares) on average. Pink open squares represent the case in which all N cells were fixed in the lattice. We used 20 different initial conditions. We ran 100 simulations for each initial condition in which we considered cell movement. We averaged all of the trials (2,000 runs for systems with cell movement and 20 runs for systems with cells fixed in the lattice). Error bars indicate standard deviations. The reaction parameter values used in Eq. 2 are listed in the Appendix as the standard parameter set.

